January 29, 2011

Plotting The Points of a Linear Equation

For any given linear equation, constructing its graph requires plotting at least two points of the given line.

When choosing points for construction, the following suggestions may be considered:

  • the points must be wide apart to include as many points as desired;
  • it's desirable to plot points whose x-coordinate and y-coordinate are whole numbers.

A point of a given line can be determined by substituting into its equation an arbitrary value of x or y. The resulting pair of x and y values correspond to the x and y coordinates of that point in the Cartesian coordinate system.

This is easy when your graph consists of just one line. But if you have several graphs and some of them, perhaps, consist of several lines, finding the points for all those lines can be an unenjoyable task.

When you want to construct several lines, this can be constructed more easily and quickly by calculating the points using spreadsheet formulas.

If you are new to spreadsheet formulas, you can just copy each formula from this web page and paste them directly into the spreadsheet cells.

These formulas are tested using Excel 2007. The formulas are very basic. I'm sure they will run in any version of Excel, or even in any spreadsheet program of your choice.

For simplicity, we will just use the constants of a linear equation in our spreadsheet calculations.

Given a linear equation in this form: Ax + By + C = 0,

  • A is the coefficient of x;
  • B is the coefficient of y;
  • C is the constant of the equation.


These are the headings to be entered in the first row:
celltext
A1A value
B1B value
C1C value
E1x value
F1y value


These are the values to be entered in cells E2 to E12:
cellx value
E25
E34
E43
E52
E61
E70
E8-1
E9-2
E10-3
E11-4
E12-5


These are the formulas to be entered in cells F2 to F12:
cellformula
F2=(-C2-E2*A2)/B2
F3=(-C2-E3*A2)/B2
F4=(-C2-E4*A2)/B2
F5=(-C2-E5*A2)/B2
F6=(-C2-E6*A2)/B2
F7=(-C2-E7*A2)/B2
F8=(-C2-E8*A2)/B2
F9=(-C2-E9*A2)/B2
F10=(-C2-E10*A2)/B2
F11=(-C2-E11*A2)/B2
F12=(-C2-E12*A2)/B2

Suppose we have the equation x - 2y = -5.

The transformed equation is x - 2y + 5 = 0.

The values we must enter for:

  • A is 1;
  • B is -2;
  • C is 5.
Here is how it might look like after entering the values.

snapshot-of-spreadsheet-containing-formulas-that-calculate-points-of-a-linear-equation

And here is the graph of the line:


Make sure that the option for calculation of the sheet is set to automatic so that every time you enter new values each cell with formula will be recalculated.

If you want a longer line, simply replace any values in the column E with a higher value.

That's it. These simple spreadsheet formulas will calculate the points of any given linear equations just as quickly as you want.

January 20, 2011

Systems of Linear Inequalities And Their Graphs

This set of problems is about the systems of:

  • two linear inequalities
  • three linear inequalities
  • four linear inequalities

The solid lines and the dashed lines are the loci of the points that satisfy the corresponding equalities.

The region where a given inequality holds true is indicated in black text.

The region where two or more inequalities hold true is indicated in yellow text.

Different color shades of the other regions simply indicate that different sets of corresponding inequalities apply to those regions.


Constructing the graphs of these inequalities requires at least two points for each of the corresponding equalities. After plotting, another two points on each side of the plotted line should be tested for the given inequality.

For those of you who want to draw the graphs the old fashioned way (that is, the paper-and-pencil method), finding the points can be a tedious task. This is where spreadsheet formulas can be a lot useful: you use spreadsheet formulas to calculate the points for you. So if you're unfamiliar with those spreadsheet formulas you might want to read my coming blog on simple spreadsheet formulas for calculating the x and y coordinates of points for a given linear equation.


Systems of Two Linear Inequalities

1. Draw the graph of the given system of inequalities:
  • 3x - 2y > -2
  • x + 3y < 5


graph-of-3x-minus-2y-greater-than-negative-2-and-x-plus-3y-less-than-5


2. Sketch the graph of the following system:
  • 3x - 4y < 2
  • 5x - y < 9


graph-of-3x-minus-4y-less-than-2-and-5x-minus-y-less-than-9


3. Sketch the graph of the following system:
  • x + 2y > -4
  • 3x + y < 3


graph-of-x-plus-2y-greater-than-negative-4-and-3x-plus-y-less-than-3


Systems of Three Linear Inequalities

1. Draw the graph of the given system of inequalities:
  • 2x + 3y > -2
  • x - 4y > -1
  • 5x + 2y < 17


graph-of-2x-plus-3y-greater-than-negative-2-and-x-minus-4y-greater-than-negative-1-and-5x-plus-2y-less-than-17


2. Draw the graph of the given system of inequalities:
  • x - 2y < -7
  • 2x - y < 4
  • x + y < 2


graph-of-x-minus-2y-less-than-negative-7-and-2x-minus-y-less-than-4-and-x-plus-y-less-than-2


3. Sketch the graph of the following system:
  • 3x - 5y < 7
  • 4x - y > -2
  • x + 4y > -9


graph-of-3x-minus-5y-less-than-7-and-4x-minus-y-greater-than-negative-2-and-x-plus-4y-greater-than-negative-9


System of Four Linear Inequalities

1. Draw the graph of the given system of inequalities:
  • 3x - 2y > -13
  • 2x + 3y < 6
  • x - 3y < 12
  • x + 6y > -21


graph-of-3x-minus-2y-greater-than-negative-13-and-2x-plus-3y-less-than-6-and-x-minus-3y-less-than-12-and-x-plus-6y-greater-than-negative-21

December 16, 2010

Graphs of Inequalities With Two Variables

In the following graphs of inequalities with 2 variables, the color-shaded regions indicate the regions containing the points that satisfy the given inequalities.

For any given inequality with two variables, there is a corresponding equality which is actually an equation of a straight line.

All points lying on the line satisfy the equality; and all points lying outside the line satisfy the corresponding inequalities.


Referring to the illustration below, the line x + 2y = - 2 is given.


graph-of-line-x-plus-2y-equals-negative-2-and-its-inequalities-x-plus-2y-is-greater-than-negative-2-and-x-plus-2y-is-less-than-negative-2

All points along the line satisfy the statement x + 2y = - 2; any other points outside of the line will make either of the two corresponding inequality statements true, x + 2y > - 2 or x + 2y < - 2.

The two sets of points (the set of points above the line and the set of points below the line) define two inequalities of opposite directions as indicated in the figure.


The next graph below is for the line x - 3y = - 4 and its corresponding inequalities x - 3y > - 4 and x - 3y < - 4.


graph-of-line-x-minus-3y-equals-negative-4-and-its-inequalities-x-minus-3y-is-greater-than-negative-4-and-x-minus-3y-is-less-than-negative-4

Observe that a change in the sign of slope of the line reverses the directions of the inequalities for the sets of points above and below the line.

Based on the above graphs, the following generalizations will be presented here: For any line whose sets of points can be differentiated into sets of points above and below it,


  • the set of points above the given line with a negative slope will always satisfy the corresponding inequality with greater than values;
  • the set of points below the given line with a positive slope will always satisfy the corresponding inequality with greater than values.

A quick way of determining the slope of a line is to convert its equation into a slope-intercept form, y = mx + b.


the-slope-intercept-form-of-a-linear-equation

The shaded regions of the succeeding four graphs are bounded by dashed lines indicating that the points along the dashed lines do not make the inequality statements true.

Problem 1 Draw the graph of 3x + 2y > 0.

graph-of-inequality-3x-plus-2y-is-greater-than-0

Problem 2 Draw the graph of 3x + 4y < 3.

graph-of-inequality-3x-plus-4y-is-less-than-3

Problem 3 Construct the graph describing the statement 2x - 5y < -10.

graph-of-inequality-2x-minus-5y-is-less-than-negative-10

Problem 4 Make a graph of x - y > - 2.

graph-of-inequality-x-minus-y-is-greater-than-negative-2

These last four diagrams are about mixed expressions of inequality and equality. The shaded region contains the set of points satisfying the inequality part of the given mixed statement while the solid line border contains the points that satisfy the equality part of the same statement.

Problem 5 Make a graph of x - 4y ≤ 6.

graph-of-inequality-x-minus-4y-is-less-than-and-equal-to-6

Problem 6 Draw the graph of 3x - 5y ≥ - 3.

graph-of-inequality-3x-minus-5y-is-greater-than-and-equal-to-negative-3

Problem 7 Sketch the graph that describes the expression 2x + 3y ≥ 6.

graph-of-inequality-2x-plus-3y-is-greater-than-and-equal-to-6

Problem 8 Sketch the graph that describes the expression 3x + 4y ≤ 6.

graph-of-inequality-3x-plus-4y-is-less-than-and-equal-to-6

November 5, 2010

Graphs of Linear Inequalities

In the following graphs, the shaded part of the number line (in red color) indicates the solution sets of the inequalities.

These problems, 20 in all, illustrate the following axioms (or postulates):


  • Axiom 1 A quantity added to both sides of an inequality does not change the direction of inequality.
  • Axiom 2 A quantity subtracted from both sides of an inequality does not change the direction of inequality.
  • Axiom 3 Multiplying both sides of an inequality by a positive number does not change the direction of inequality.
  • Axiom 4 Dividing both sides of an inequality by a positive number does not change the direction of inequality.
  • Axiom 5 Multiplying both sides of an inequality by a negative number changes the direction of inequality.
  • Axiom 6 Dividing both sides of an inequality by a negative number changes the direction of inequality.
Problems 4, 7, 8, 9, 12, 16 and 19 illustrate axioms 5 and 6.

The rest of the problems illustrate the remaining axioms.


1.5x + 4 < 3x + 8
Answer: { x | x < 2 }


graph of a number line with all values less than 2 shaded in red
2.x/3 - 3 < -1
Answer: { x | x < 6 }


graph of a number line with all values less than 6 shaded in red
3.2x + 6 > 16
Answer: { x | x > 5 }


graph of a number line with all values greater than 5 shaded in red
4.x - 4 ≥ 9x - 60
Answer: { x | x ≤ 7 }


graph of a number line with all values less than or equal to 7 shaded in red
5.8x + 5 ≥ 3x + 10
Answer: { x | x ≥ 1 }


graph of a number line with all values greater than or equal to 1 shaded in red
6.2x - 3 > 9
Answer: { x | x > 6 }


graph of a number line with all values greater than 6 shaded in red
7.x - 8 > 6x - 13
Answer: { x | x < 1 }


graph of a number line with all values less than 1 shaded in red
8.4 - 5x > -6
Answer: { x | x < 2 }


graph of a number line with all values less than 2 shaded in red
9.4 - 16x > 8
Answer: { x | x < - 1/4 }


graph of a number line with all values less than - 1/4 shaded in red
10.x/2 + 7 > 9
Answer: { x | x > 4 }


graph of a number line with all values greater than 4 shaded in red
11.9x + 5 > 4x + 40
Answer: { x | x > 7 }


graph of a number line with all values greater than 7 shaded in red
12.8 - 5x < 5
Answer: { x | x > 3/5 }


graph of a number line with all values greater than 3/5 shaded in red
13.3x/4 + 2 > 8
Answer: { x | x > 8 }


graph of a number line with all values greater than 8 shaded in red
14.2x - 5 ≤ x + 1
Answer: { x | x ≤ 6 }


graph of a number line with all values less than or equal to 6 shaded in red
15.5x + 3 < 38
Answer: { x | x < 7 }


graph of a number line with all values less than 7 shaded in red
16.7 - 8x < 3
Answer: { x | x > 1/2 }


graph of a number line with all values greater than 1/2 shaded in red
17.4x + 3 ≤ 3x + 10
Answer: { x | x ≤ 7 }


graph of a number line with all values less than or equal to 7 shaded in red
18.5x + 7 < -8
Answer: { x | x < -3 }


graph of a number line with all values less than -3 shaded in red
19.2 - 5x < -33
Answer: { x | x > 7 }


graph of a number line with all values greater than 7 shaded in red
20.2x - 5 > -21
Answer: { x | x > -8 }


graph of a number line with all values greater than -8 shaded in red

October 15, 2010

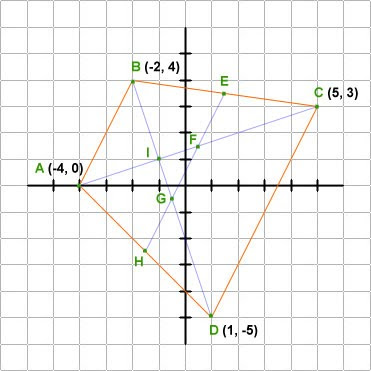
Coordinate Graphs of Quadrilaterals With Their Diagonals And Medians

The illustrated problems given below are graphs of the following quadrilaterals:

  • rectangles
  • squares
  • rhombus
  • trapezoids

Unlike my earlier post about quadrilaterals (see Coordinate Graphs of Quadrilaterals, dated July 2010), these problems focus on the properties of the diagonals and median of quadrilaterals.

These properties are as follows:

  • A diagonal divides a parallelogram into two congruent triangles (see Problems 1, 4 and 7).
  • Diagonals of a parallelogram bisect each other, that is, the point of intersection of the diagonals is their midpoint (see Problems 1, 4 and 7).
  • Midpoints of the sides of a parallelogram, when joined together, form another parallelogram (see Problems 2 and 3).
  • Diagonals of a rhombus bisect its angles and are perpendicular to each other (see Problem 7).
  • Diagonals of a rectangle are equal (see Problem 1 and 4).
  • Diagonals of an isosceles trapezoid are equal (see Problem 5 and 6).
  • The point of intersection of the diagonals of an isosceles trapezoid trisects the diagonals (see Problem 5 and 6).
  • The median of a trapezoid is parallel to its bases (see Problem 6).
  • The median of a trapezoid is equal to one half the sum of its bases (see Problem 6).
  • The median of a trapezoid intersects each of its diagonals at their midpoints (see Problem 6).


Concepts Illustrated By the Problems


  • distance between two points
  • properties of parallel and perpendicular lines
  • point of intersection of two straight lines
  • equation of a straight line
  • midpoint of a line segment
  • angle between two lines
  • angle bisector


Description of the Problems


Depending on the graph, a combination of the following information are provided:

  • equations of the line segments
  • slopes of the line segments
  • x-intercepts and y-intercepts of the lines
  • distances between the terminal points of the line segments
  • midpoints of the line segments

Using one or a combination of two or more of the above information, it is possible for a problem to be presented in several ways.

Line segments and their terminal points referred to in the problems are the sides and vertices, respectively, of the quadrilaterals.

Slope of a line segment with terminal points A and B is abbreviated as mAB.

Distance between points A and B is abbreviated as distanceAB


Problem 1


coordinate graph of a rectangle and its diagonals

Point of Intersection of the Diagonals: E (- 1/2, -1)

Distances Between Points
  • distanceAB = distanceCD = √ 68
  • distanceAD = distanceBC = √ 17
  • distanceAC = distanceBD = √ 85
  • distanceAE = distanceCE = distanceBE = distanceDE = √ 85/4


Equations of the Line Segments
  • line segment AB : x - 4y + 5 = 0 (x-intercept = -5; y-intercept = 5/4)
  • line segment BC : 4x + y - 14 = 0 (x-intercept = 14/4; y-intercept = 14)
  • line segment CD : x - 4y - 12 = 0 (x-intercept = 12; y-intercept = -3)
  • line segment AD : 4x + y + 20 = 0 (x-intercept = -5; y-intercept = -20)
  • line segment AC : 2x + 9y + 10 = 0 (x-intercept = -5; y-intercept = -10/9)
  • line segment BD : 6x - 7y - 4 = 0 (x-intercept = 2/3; y-intercept = - 4/7)


Slopes of the Line Segments
  • mAB = mCD = 1/4
  • mAD = mBC = -4
  • mAC = - 2/9
  • mBD = 6/7


Problem 2


coordinate graph of a rectangle with an inscribed rhombus

Midpoints of Rectangle ABCD
  • E (-1, 9/2)
  • F (0, 0)
  • G (-3,- 7/2)
  • H (-4, 1)


Distances Between Points
  • distanceAB = distanceCD = √ 17
  • distanceAD = distanceBC = √ 68
  • distanceEF = distanceFG = distanceGH = distanceEH = √ 85/4
  • distanceAE = distanceBE = distanceCG = distanceDG = √ 17/4
  • distanceAH = distanceDH = distanceBF = distanceCF = √ 17


Equations of the Line Segments
  • line segment AB : x + 4y - 17 = 0 (x-intercept = 17; y-intercept = 17/4)
  • line segment BC : 4x - y = 0 (x-intercept = 0; y-intercept = 0)
  • line segment CD : x + 4y + 17 = 0 (x-intercept = -17; y-intercept = - 17/4)
  • line segment AD : 4x - y + 17 = 0 (x-intercept = - 17/4; y-intercept = 17)
  • line segment EF : 9x + 2y = 0 (x-intercept = 0; y-intercept = 0)
  • line segment FG : 7x - 6y = 0 (x-intercept = 0; y-intercept = 0)
  • line segment GH : 9x + 2y + 34 = 0 (x-intercept = -34/9; y-intercept = -17)
  • line segment EH : 7x - 6y + 34 = 0 (x-intercept = -34/7; y-intercept = 17/3)


Slopes of the Line Segments
  • mAB = mCD = - 1/4
  • mAD = mBC = 4
  • mEF = mGH = - 9/2
  • mEH = mFG = 7/6


Problem 3


coordinate graph of a square with an inscribed square

Midpoints of Square ABCD
  • E (-1, 4)
  • F (4, 1)
  • G (1, -4)
  • H (-4, -1)


Distances Between Points
  • distanceAB = distanceBC = distanceCD = distanceAD = √ 68
  • distanceEF = distanceFG = distanceGH = distanceEH = √ 34
  • distanceAE = distanceBE = distanceBF = distanceCF = distanceCG = distanceDG = distanceAH = distanceDH = √ 17


Equations of the Line Segments
  • line segment AB : x - 4y + 17 = 0 (x-intercept = -17; y-intercept = 17/4)
  • line segment BC : 4x + y - 17 = 0 (x-intercept = 17/4; y-intercept = 17)
  • line segment CD : x - 4y - 17 = 0 (x-intercept = 17; y-intercept = - 17/4)
  • line segment AD : 4x + y + 17 = 0 (x-intercept = - 17/4; y-intercept = -17)
  • line segment EF : 3x + 5y - 17 = 0 (x-intercept = 17/3; y-intercept = 17/5)
  • line segment FG : 5x - 3y - 17 = 0 (x-intercept = 17/5; y-intercept = - 17/3)
  • line segment GH : 3x + 5y + 17 = 0 (x-intercept = - 17/3; y-intercept = - 17/5)
  • line segment EH : 5x - 3y + 17 = 0 (x-intercept = - 17/5; y-intercept = 17/3)


Slopes of the Line Segments
  • mAB = mCD = 1/4
  • mAD = mBC = -4
  • mEF = mGH = - 3/5
  • mFG = mEH = 5/3


Problem 4


coordinate graph of a square and its diagonals

Point of Intersection of the Diagonals: E (0, 0)

Distances Between Points

  • distanceAB = distanceBC = distanceCD = distanceAD = √ 52
  • distanceAC = distanceBD = √ 104
  • distanceAE = distanceCE = distanceBE = distanceDE = √ 26


Equations of the Line Segments
  • line segment AB : 2x + 3y - 13 = 0 (x-intercept = 13/2; y-intercept = 13/3)
  • line segment BC : 3x - 2y - 13 = 0 (x-intercept = 13/3; y-intercept = - 13/2)
  • line segment CD : 2x + 3y + 13 = 0 ( x-intercept = - 13/2; y-intercept = - 13/3)
  • line segment AD : 3x - 2y + 13 = 0 (x-intercept = - 13/3; y-intercept = 13/2)
  • line segment AC : 5x + y = 0 (x-intercept = 0; y-intercept = 0)
  • line segment BD : x - 5y = 0 (x-intercept = 0; y-intercept = 0)


Slopes of the Line Segments
  • mAB = mCD = - 2/3
  • mBC = mAD = 3/2
  • mAC = -5
  • mBD = 1/5


Problem 5


coordinate graph of a trapezoid and its diagonals

Point of Intersection of the Diagonals: E (-2, 1)

Distances Between Points
  • distanceAB = √ 20
  • distanceCD = √ 80
  • distanceAD = distanceBC = √ 50
  • distanceAC = distanceBD = √ 90
  • distanceAE = 1/3 (distanceAC) = (√ 90)/3 = √ 10
  • distanceBE = 1/3 (distanceBD) = (√ 90)/3 = √ 10


Equations of the Line Segments
  • line segment AB : x - 2y + 9 = 0 (x-intercept = -9; y-intercept = 9/2)
  • line segment BC : x + y - 3 = 0 (x-intercept = 3; y-intercept = 3)
  • line segment CD : x - 2y - 6 = 0 (x-intercept = 6; y-intercept = -3)
  • line segment AD : 7x + y + 33 = 0 (x-intercept = - 33/7; y-intercept = -33)
  • line segment AC : x + 3y - 1 = 0 (x-intercept = 1; y-intercept = 1/3)
  • line segment BD : 3x - y + 7 = 0 (x-intercept = - 7/3; y-intercept = 7)


Slopes of the Line Segments
  • mAB = mCD = 1/2
  • mBC = -1
  • mAD = -7
  • mAC = - 1/3
  • mBD = 3


Problem 6


coordinate graph of a trapezoid and its diagonals and median

Point of Intersection of the Diagonals: I (-1, 1)

Midpoints of
  • line segment BC: E (3/2, 7/2)
  • line segment AD: H (- 3/2, - 5/2)
  • diagonal AC: F (1/2, 3/2)
  • diagonal BD: G (- 1/2, - 1/2)


Distances Between Points
  • distanceAB = √ 20
  • distanceCD = √ 80
  • distanceAD = distanceBC = √ 50
  • distanceAC = distanceBD = √ 90
  • distanceEH = √ 45 = ½( distanceAB + distanceCD ) = ½(√ 20 + √ 80)
  • distanceAF = distanceCF = distanceBG = distanceDG = √ 45/2
  • distanceAI = 1/3 (distanceAC) = (√ 90)/3 = √ 10
  • distanceBI = 1/3 (distanceBD) = (√ 90)/3 = √ 10


Equations of the Line Segments
  • line segment AB : 2x - y + 8 = 0 (x-intercept = -4; y-intercept = 8)
  • line segment BC : x + 7y - 26 = 0 (x-intercept = 26; y-intercept = 26/7)
  • line segment CD : 2x - y - 7 = 0 (x-intercept = 7/2; y-intercept = -7)
  • line segment AD : x + y + 4 = 0 (x-intercept = -4; y-intercept = -4)
  • line segment AC : x - 3y + 4 = 0 (x-intercept = -4; y-intercept = 4/3)
  • line segment BD : 3x + y + 2 = 0 (x-intercept = - 2/3; y-intercept = -2)
  • line segment EH : 4x - 2y + 1 = 0 (x-intercept = - 1/4; y-intercept = 1/2)


Slopes of the Line Segments
  • mAB = mCD = mEH = 2
  • mBC = - 1/7
  • mAD = -1
  • mAC = 1/3
  • mBD = -3


Problem 7


coordinate graph of a rhombus and its diagonals

Point of Intersection of the Diagonals: E (1, 0)

Distances Between Points
  • distanceAB = distanceBC = distanceCD = distanceAD = √ 40
  • distanceAC = √ 128
  • distanceBD = √ 32
  • distanceAE = distanceCE = √ 32
  • distanceBE = distanceDE = √ 8


Equations of the Line Segments
  • line segment AB : x + 3y - 9 = 0 (x-intercept = 9; y-intercept = 3)
  • line segment BC : 3x + y - 11 = 0 (x-intercept = 11/3; y-intercept = 11)
  • line segment CD : x + 3y + 7 = 0 (x-intercept = -7; y-intercept = - 7/3)
  • line segment AD : 3x + y + 5 = 0 (x-intercept = - 5/3; y-intercept = -5)
  • line segment AC : x + y - 1 = 0 (x-intercept = 1; y-intercept = 1)
  • line segment BD : x - y - 1 = 0 (x-intercept = 1; y-intercept = -1)


Slopes of the Line Segments
  • mAB = mCD = - 1/3
  • mBC = mAD = -3
  • mAC = -1
  • mBD = 1


Interior Angles of Rhombus ABCD
  • angle A = angle C = 53.13°
  • angle B = angle D = 126.87°
  • angle BAC = angle CAD = angle ACB = angle ACD = 26.57°
  • angle ABD = angle CBD = angle BDC = angle ADB = 63.43°