For any given linear equation, constructing its graph requires plotting at least two points of the given line.
When choosing points for construction, the following suggestions may be considered:
- the points must be wide apart to include as many points as desired;
- it's desirable to plot points whose x-coordinate and y-coordinate are whole numbers.
A point of a given line can be determined by substituting into its equation an arbitrary value of x or y. The resulting pair of x and y values correspond to the x and y coordinates of that point in the Cartesian coordinate system.
This is easy when your graph consists of just one line. But if you have several graphs and some of them, perhaps, consist of several lines, finding the points for all those lines can be an unenjoyable task.
When you want to construct several lines, this can be constructed more easily and quickly by calculating the points using spreadsheet formulas.
If you are new to spreadsheet formulas, you can just copy each formula from this web page and paste them directly into the spreadsheet cells.
These formulas are tested using Excel 2007. The formulas are very basic. I'm sure they will run in any version of Excel, or even in any spreadsheet program of your choice.
For simplicity, we will just use the constants of a linear equation in our spreadsheet calculations.
Given a linear equation in this form: Ax + By + C = 0,
- A is the coefficient of x;
- B is the coefficient of y;
- C is the constant of the equation.
These are the headings to be entered in the first row:
| cell | text |
|---|---|
| A1 | A value |
| B1 | B value |
| C1 | C value |
| E1 | x value |
| F1 | y value |
These are the values to be entered in cells E2 to E12:
| cell | x value |
|---|---|
| E2 | 5 |
| E3 | 4 |
| E4 | 3 |
| E5 | 2 |
| E6 | 1 |
| E7 | 0 |
| E8 | -1 |
| E9 | -2 |
| E10 | -3 |
| E11 | -4 |
| E12 | -5 |
These are the formulas to be entered in cells F2 to F12:
| cell | formula |
|---|---|
| F2 | =(-C2-E2*A2)/B2 |
| F3 | =(-C2-E3*A2)/B2 |
| F4 | =(-C2-E4*A2)/B2 |
| F5 | =(-C2-E5*A2)/B2 |
| F6 | =(-C2-E6*A2)/B2 |
| F7 | =(-C2-E7*A2)/B2 |
| F8 | =(-C2-E8*A2)/B2 |
| F9 | =(-C2-E9*A2)/B2 |
| F10 | =(-C2-E10*A2)/B2 |
| F11 | =(-C2-E11*A2)/B2 |
| F12 | =(-C2-E12*A2)/B2 |
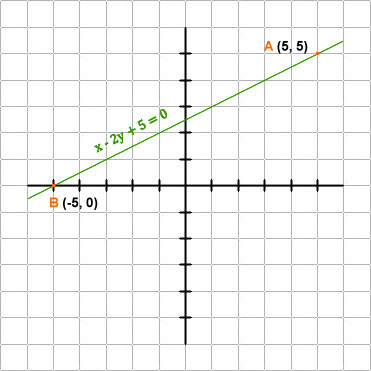
Suppose we have the equation x - 2y = -5.
The transformed equation is x - 2y + 5 = 0.
The values we must enter for:
- A is 1;
- B is -2;
- C is 5.

And here is the graph of the line:

Make sure that the option for calculation of the sheet is set to automatic so that every time you enter new values each cell with formula will be recalculated.
If you want a longer line, simply replace any values in the column E with a higher value.
That's it. These simple spreadsheet formulas will calculate the points of any given linear equations just as quickly as you want.


