For any given inequality with two variables, there is a corresponding equality which is actually an equation of a straight line.
All points lying on the line satisfy the equality; and all points lying outside the line satisfy the corresponding inequalities.
Referring to the illustration below, the line x + 2y = - 2 is given.

All points along the line satisfy the statement x + 2y = - 2; any other points outside of the line will make either of the two corresponding inequality statements true, x + 2y > - 2 or x + 2y < - 2.
The two sets of points (the set of points above the line and the set of points below the line) define two inequalities of opposite directions as indicated in the figure.
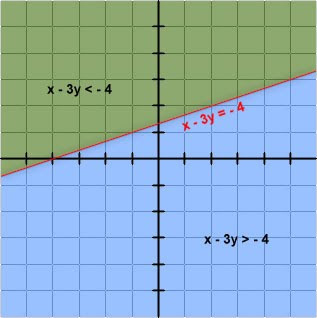
The next graph below is for the line x - 3y = - 4 and its corresponding inequalities x - 3y > - 4 and x - 3y < - 4.

Observe that a change in the sign of slope of the line reverses the directions of the inequalities for the sets of points above and below the line.
Based on the above graphs, the following generalizations will be presented here: For any line whose sets of points can be differentiated into sets of points above and below it,
- the set of points above the given line with a negative slope will always satisfy the corresponding inequality with greater than values;
- the set of points below the given line with a positive slope will always satisfy the corresponding inequality with greater than values.
A quick way of determining the slope of a line is to convert its equation into a slope-intercept form, y = mx + b.

The shaded regions of the succeeding four graphs are bounded by dashed lines indicating that the points along the dashed lines do not make the inequality statements true.
Problem 1 Draw the graph of 3x + 2y > 0.

Problem 2 Draw the graph of 3x + 4y < 3.

Problem 3 Construct the graph describing the statement 2x - 5y < -10.

Problem 4 Make a graph of x - y > - 2.

These last four diagrams are about mixed expressions of inequality and equality. The shaded region contains the set of points satisfying the inequality part of the given mixed statement while the solid line border contains the points that satisfy the equality part of the same statement.
Problem 5 Make a graph of x - 4y ≤ 6.
Problem 6 Draw the graph of 3x - 5y ≥ - 3.

Problem 7 Sketch the graph that describes the expression 2x + 3y ≥ 6.

Problem 8 Sketch the graph that describes the expression 3x + 4y ≤ 6.
